HiSCORE and TAIGA
Universität Hamburg
Simulations
In order to predict the performance of the planned detector array HiSCORE, a number of simulations have been conducted. The CORSIKA code (D. Heck et al., Report FZKA 6019 (1998)) with its Cherenkov option was used to generate air showers and store the observable cherenkov photons at given detector station positions. The cherenkov photon files are read out by sim_score, which simulates important effects as the atmospheric absorption, the PMT answer function, the QE effeciency of the PMT (wavelength dependent), the angle dependent effects of the light concentrators (Winston Cones) and noise generated by Night Sky Background.
Event ReconstructionAn event reconstruction has been developed (see Documents section for detailed description) which reconstructs key parameters of the air shower as shower core position, shower depth, energy and direction of the primary particle. By comparing the reconstructed values to the Monte Carlo input parameters, the resolution of the detector can be estimated. It has been found that a basic gamma / hadron separation can be applied by using timing information. Currently, the power of self-learning algorithms for this task is under study. |
SensitivityAn important value to describe the power of a gamma ray instrument is the point source sensitivity. It is defined as the minimal gamma flux that is needed to identify a source (with more that 5 sigma above the Cosmic Ray background) in a certain observation time. For Cherenkov Telescopes usually a time of 50 hours is used, while sensitivities of wide angle instruments like HiSCORE or HAWK are usually given for a longer time period, as they can watch all sources in the field of view at the same time. 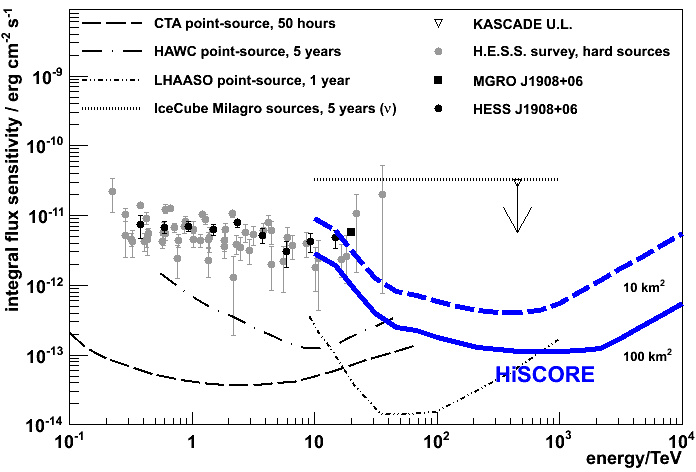 Fig 1: Expected sensitivity for SCORE (10 km^2) and HiSCORE (100 km^2), compared with other experiments. Click onto the image for a larger version. Shown in Fig 1 is a preliminary sensitivity plot for SCORE (10 sqkm) and HiSCORE (100 sqkm) for 500 hours of observation and a miminmum of 50 events (which defines the high energy end of the sensitive energy range). For comparison, other currently existing and planned instruments are shown, too. A new sensitivity curve, taking into account new results from the event reconstruction tests, will be posted here soon. |
Observable objects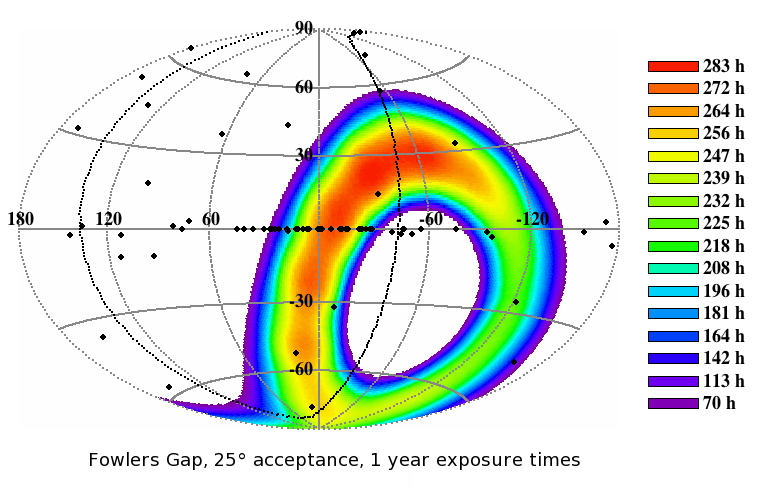 Fig 2: Skymap with HiSCORE observation time (uptime for one year, not considering bad weather conditions). Click onto the image for a larger version. In Fig 2 a skymap in galactical coordinates is shown with a colour map, indicating possible observation times for the various regions of the sky. Given are the observation times for one year (about 1500 hours of observation). Additionally, all so far known TeV gamma ray sources (black dots) and the supergalactic plane (black line) are plotted. The simulation takes into account the position of the moon (and the sun, of course), as only moonless nights are suitable for observation. In reality, a moderate decrease of about 25% of the shown observation times is expected as the duty cycle is reduced by bad viewing conditions (clouds, mainly). In this version of the the skymap a detector position at about 31 deg south is assumed (southern Australia, Namibia, ...). As one can see, a good number of known TeV gamma ray sources are within the field of view of HiSCORE, as well as a large part of the galactic plane (horizontal line at zero degrees) and a part of the supergalactic plane. |